Research Project Full Title: NASA ROSES ACCESS Development of Tools
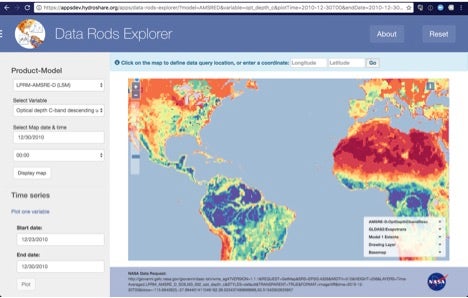
Full Abstract: The Data Rods Explorer (DRE, https://apps.hydroshare.org/apps/data-rods-explorer/) is a web app developed under a NASA grant by Gonzalo Espinoza, PhD candidate, and David Arctur, research scientist. DRE is a web client app that enables users to browse several NASA-hosted data sets. The interface enables visualization and download of NASA observation retrievals and land surface model (LSM) outputs by variable, space and time. The key variables are precipitation, wind, temperature, surface downward radiation flux, heat flux, humidity, soil moisture, groundwater, runoff, and evapotranspiration. These variables describe the main components of the water cycle over land masses. The term “data rod” comes from a mental image of a rod through a stack of grids (maps) of the time-varying values of a hydrological variable at a fixed location in space.
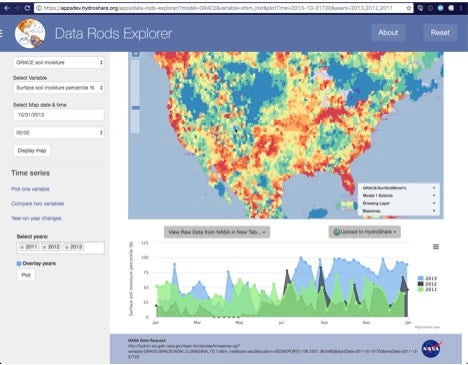
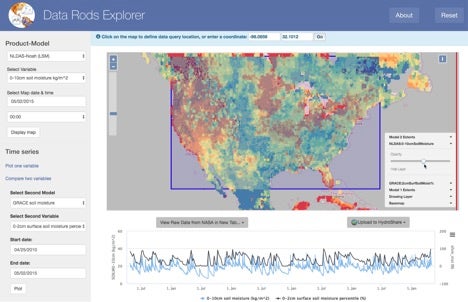
The user can obtain a map of a variable at any valid date-time stamp; plot a time series (data rod) of values at a point location; compare two model variables’ time series over a mutually-available time period; and plot year-on-year changes in time series for a given model or retrieval variable. Tabular text format, csv, xls, netCDF, and plots of time series can be downloaded, as well as graphic images of the plots. Data query results may be uploaded to a user’s account in HydroShare.org.
These figures illustrate three of the model functions: (1) map display, (2) year-to-year comparison, and (3) model-to-model comparison. For more details on these data sources and the DRE web app, see documentation at: https://github.com/gespinoza/datarodsexplorer/blob/master/docs/DREUserGuide.md.